Combined plot of all years, cumulative wind stress
Individual years, wind stress and cumulative wind stress (plots & data access):
2022 2021 2020 2019 2018 2017 2016 2015 2014 2013 2012 2011 2010 2009 2008 2007 2006 2005 2004 2003 2002 2001 2000 1999 1998 1997 1996 1995 1994 1993 1992 1991 1990 1989 1988 1987 1986 1985
Wind stress, cumulative wind stress, and spring transition dates:
data products for Oregon upwelling-related research
S. D. Pierce and
J. A. Barth
College of Earth, Ocean, & Atmospheric Sciences
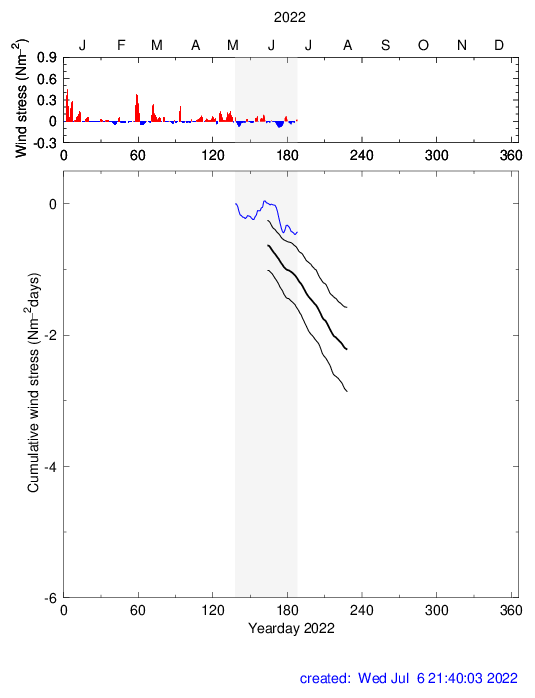
Upper panel above shows alongshore wind stress (blue is upwelling-favorable). Lower panel shows wind stress cumulative from the spring transition and ending with the fall transition, for this year (blue line). Also shown on the lower panel are the means and standard deviations for the 1985-2008 period (black lines). Ascii data file of wind stress and cumulative wind stress for this year.